A) the price level rises at a diminishing rate as the level of aggregate demand increases.
B) full employment and price stability are compatible goals only when aggregate demand is falling.
C) each successive unit of decline in the unemployment rate is accompanied by a smaller increase in the rate of inflation.
D) each successive unit of decline in the unemployment rate is accompanied by a larger increase in the rate of inflation.
F) A) and B)
Correct Answer

verified
Correct Answer
verified
Multiple Choice
One policy dilemma posed by cost-push inflation is that:
A) an increase in aggregate demand will increase inflation and the unemployment rate simultaneously.
B) tax rates can be reduced without lowering tax revenues.
C) the reduction of aggregate demand to restrain inflation will cause a further reduction in the real GDP.
D) the adjustment of aggregate demand can neither increase real GDP nor reduce inflation.
F) B) and C)
Correct Answer

verified
Correct Answer
verified
Multiple Choice
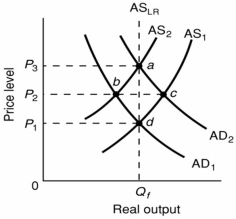 -Refer to the above diagram. The initial aggregate demand curve is AD1 and the initial aggregate supply curve is AS1. If government offsets the decline in real output resulting from short-run cost-push inflation by increasing aggregate demand from AD1 to AD2:
A) real output will rise above Qf.
B) the price level will rise from P1 to P2.
C) it is possible that aggregate supply will shift rightward from AS2 because nominal wage demands will rise.
D) the price level will rise from P2 to P3.
F) All of the above
Correct Answer

verified
D
Correct Answer
verified
Multiple Choice
Many economists doubt the proposition that supply-side tax cuts increase aggregate:
A) demand more rapidly than aggregate supply.
B) demand less rapidly than aggregate supply.
C) supply more rapidly than aggregate demand.
D) supply less rapidly than aggregate demand.
F) A) and B)
Correct Answer

verified
Correct Answer
verified
Multiple Choice
 -Refer to the above diagram. The initial aggregate demand curve is AD1 and the initial aggregate supply curve is AS1. Cost-push inflation in the short run is best represented as a:
A) leftward shift of the aggregate supply curve from AS1 to AS2.
B) rightward shift of the aggregate demand curve from AD1 to AD2.
C) move from d to b to a.
D) move from d directly to a.
F) A) and D)
Correct Answer

verified
Correct Answer
verified
Multiple Choice
What will occur in the short run if there is cost-push inflation and if the government adopts a hands-off approach to it?
A) an increase in long-run aggregate supply
B) a decrease in long-run aggregate supply
C) low unemployment and a loss of real output
D) high unemployment and a loss of real output
F) C) and D)
Correct Answer

verified
Correct Answer
verified
True/False
The short-run aggregate supply curve is vertical and the long-run aggregate supply curve is horizontal.
B) False
Correct Answer

verified
Correct Answer
verified
True/False
The long-run Phillips Curve is essentially a horizontal line at the economy's natural rate of unemployment.
B) False
Correct Answer

verified
Correct Answer
verified
Multiple Choice
An adverse aggregate supply shock:
A) automatically shifts the aggregate demand curve rightward.
B) causes the Phillips Curve to shift leftward and downward.
C) can be caused by a boost in the rate of growth of productivity.
D) can cause stagflation.
F) All of the above
Correct Answer

verified
D
Correct Answer
verified
Multiple Choice
A major adverse aggregate supply shock:
A) automatically shifts the aggregate demand curve rightward.
B) causes the Phillips Curve to shift outward .
C) can be caused by rising productivity.
D) can be caused by falling wages.
F) A) and B)
Correct Answer

verified
Correct Answer
verified
Multiple Choice
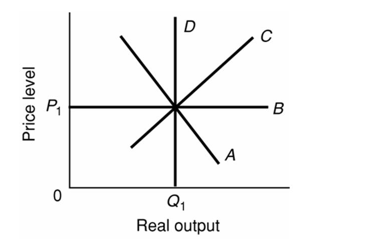 -Refer to the above diagram and assume that prices and wages are flexible both upward and downward in the economy. In the long run AD-AS model:
A) demand-pull inflation would involve a shift of curve D to the right.
B) cost-push inflation would involve a shift of curve B downward.
C) recession would involve a leftward shift of curve A.
D) frictional unemployment would be zero in the long run.
F) C) and D)
Correct Answer

verified
Correct Answer
verified
Multiple Choice
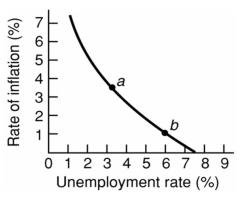 -Refer to the above diagram for a specific economy. Which of the following best describes the relationship shown by this curve?
A) The demand for labor is large when the rate of inflation is small.
B) When the rate of unemployment is high, the rate of inflation is high.
C) The rate of inflation and the rate of unemployment are inversely related.
D) The rate of inflation and the rate of unemployment are directly related.
F) A) and C)
Correct Answer

verified
C
Correct Answer
verified
True/False
More inflation is likely to result when the government enacts policies to maintain full employment when there is cost-push inflation.
B) False
Correct Answer

verified
Correct Answer
verified
Multiple Choice
Demand-pull inflation in the short run increases the price level and:
A) real wages.
B) real output.
C) unemployment.
D) nominal wages.
F) A) and C)
Correct Answer

verified
Correct Answer
verified
Multiple Choice
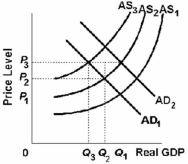 -Refer to the above graph. Given that the economy is at an initial equilibrium where the AD1 and AS1 curves intersect, demand-pull inflation in the short run can best be represented by a shift from:
A) AS1 to AS3.
B) AD1 to AD2.
C) AS1 to AS2.
D) AD2 to AD1.
F) All of the above
Correct Answer

verified
Correct Answer
verified
Multiple Choice
A basic criticism of supply-side economics is that:
A) empirical research clearly shows that incentives to work and invest vary directly with marginal tax rates.
B) lower taxes will increase aggregate supply much more than they will increase aggregate demand.
C) lower taxes will increase aggregate demand much more than they will increase aggregate supply.
D) higher taxes will reduce incentives to work, invest, and innovate.
F) A) and B)
Correct Answer

verified
Correct Answer
verified
True/False
The Laffer Curve suggests that lower tax rates will decrease saving and increase consumption.
B) False
Correct Answer

verified
Correct Answer
verified
Multiple Choice
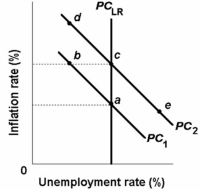 -Refer to the above diagram. The move of the economy from c to e on short-run Phillips Curve PC2 would be explained by an:
A) increase in aggregate demand in the economy.
B) increase in aggregate supply in the economy.
C) actual rate of inflation that is less than the expected rate.
D) actual rate of inflation that exceeds the expected rate.
F) None of the above
Correct Answer

verified
Correct Answer
verified
Multiple Choice
The long-run aggregate supply curve:
A) is downward sloping.
B) is vertical.
C) is horizontal.
D) is upward sloping.
F) B) and C)
Correct Answer

verified
Correct Answer
verified
True/False
The short-run aggregate supply curve shifts to the left when nominal wages rise in response to price level increases.
B) False
Correct Answer

verified
Correct Answer
verified
Showing 1 - 20 of 122
Related Exams